Introduction
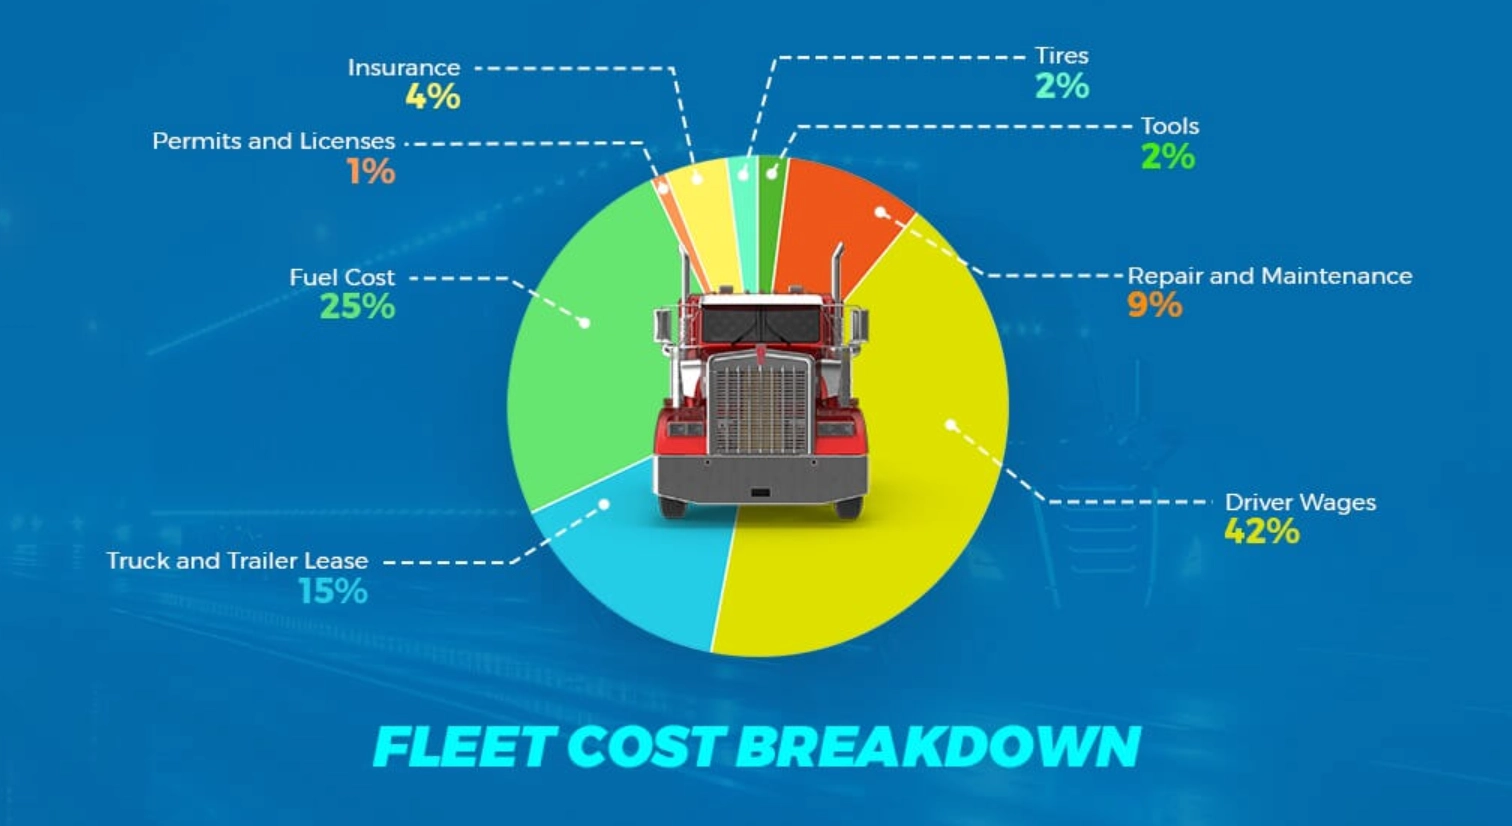
Fleet operators and procurement teams often face tough choices when budgeting for tyres. Many focus heavily on the sticker price at purchase time. That approach misses the bigger picture. Fleet tyre cost modeling: cost per KM/hour vs initial price reveals how total expenses unfold over thousands of kilometers or operating hours.
Initial price represents only one piece of the equation. Real costs emerge from fuel use, wear rates, maintenance needs, and unplanned stops. A lower upfront figure can translate into higher spending down the road if performance falls short. Fleet tyre cost modeling focuses on cost per kilometer or cost per operating hour, rather than judging tyres only by their initial purchase price.
One regional delivery operation learned this lesson the hard way. Economy tyres saved money at the outset but wore out faster and increased fuel burn. Within a year, the fleet spent more overall than with higher-quality options. Shifting perspective to lifecycle metrics changes decisions and bottom-line results.
This modeling approach gains traction as fuel prices fluctuate and fleets seek tighter control over variable expenses. Managers who track cost per kilometer or hour uncover patterns hidden in simple purchase records. The shift encourages investments that pay back through sustained operation.
Key Factors in Fleet Tyre Lifecycle Cost
Several elements drive total tyre expenses beyond the purchase point.
Tyre lifespan stands out prominently. Premium constructions deliver longer mileage or hours before replacement. Compounds resist heat and abrasion better, extending service intervals. Highway applications often see differences of tens of thousands of kilometers between options.
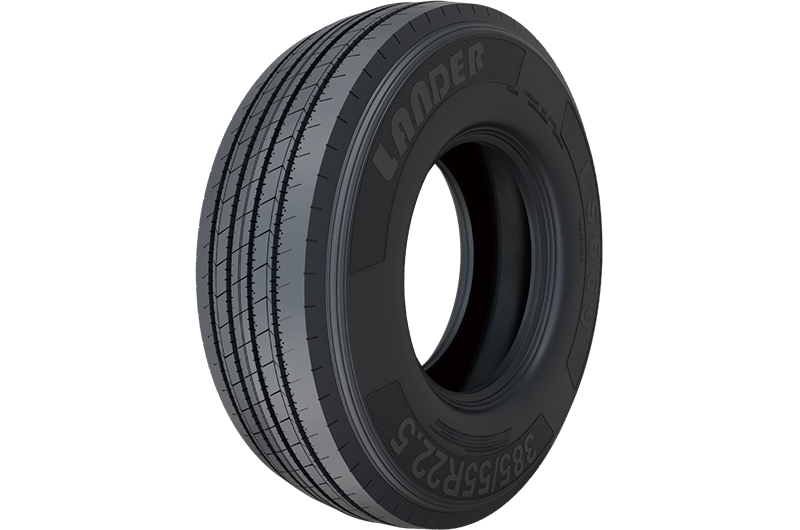
Fuel efficiency ties directly to rolling resistance. Tyres that roll easier demand less engine power. Even small differences compound over long distances. Industry figures show rolling resistance accounting for substantial portions of fuel consumption in heavy vehicles. Long-haul routes amplify this effect.
Downtime carries hidden weight. Unexpected failures halt vehicles and disrupt schedules. Repair waits, driver idle time, and missed deliveries add up quickly. Reliable tyres reduce these interruptions. One roadside incident can cost thousands in lost productivity.
Maintenance and retreading potential influence outcomes too. Casings that accept multiple retreads spread costs further. Proper inflation and alignment extend wear, but tyre design sets the foundation. Stronger belts and sidewalls support additional lives.
Environmental conditions accelerate these factors. Hot climates increase heat-related wear. Mixed routes combine abrasion and impact stress. Matching design to reality shapes final numbers.
How to Calculate Fleet Tyre Cost per Kilometer or Hour
Accurate modeling starts with clear formulas.
Cost per kilometer divides total expenses by distance covered. Include purchase price, fuel attributable to tyres, maintenance, and downtime value. Divide by kilometers achieved.
For operating hours common in off-road work, substitute hours for distance. This captures slow-speed, high-load conditions where time matters more than mileage. Mining or construction sites favor this view.
Breakdown looks like this: total cost equals initial price plus fuel costs plus downtime costs plus maintenance, all divided by kilometers or hours run.
A long-haul fleet running 150,000 kilometers annually might see premium tyres cost more upfront but deliver lower figures overall. Fuel savings alone often offset differences within the first year.
Mixed fleets adapt the model. Weighted averages account for varied duty cycles. Consistent data collection ensures reliable inputs.
Premium vs Economy Tyres: Cost per Kilometer Comparison
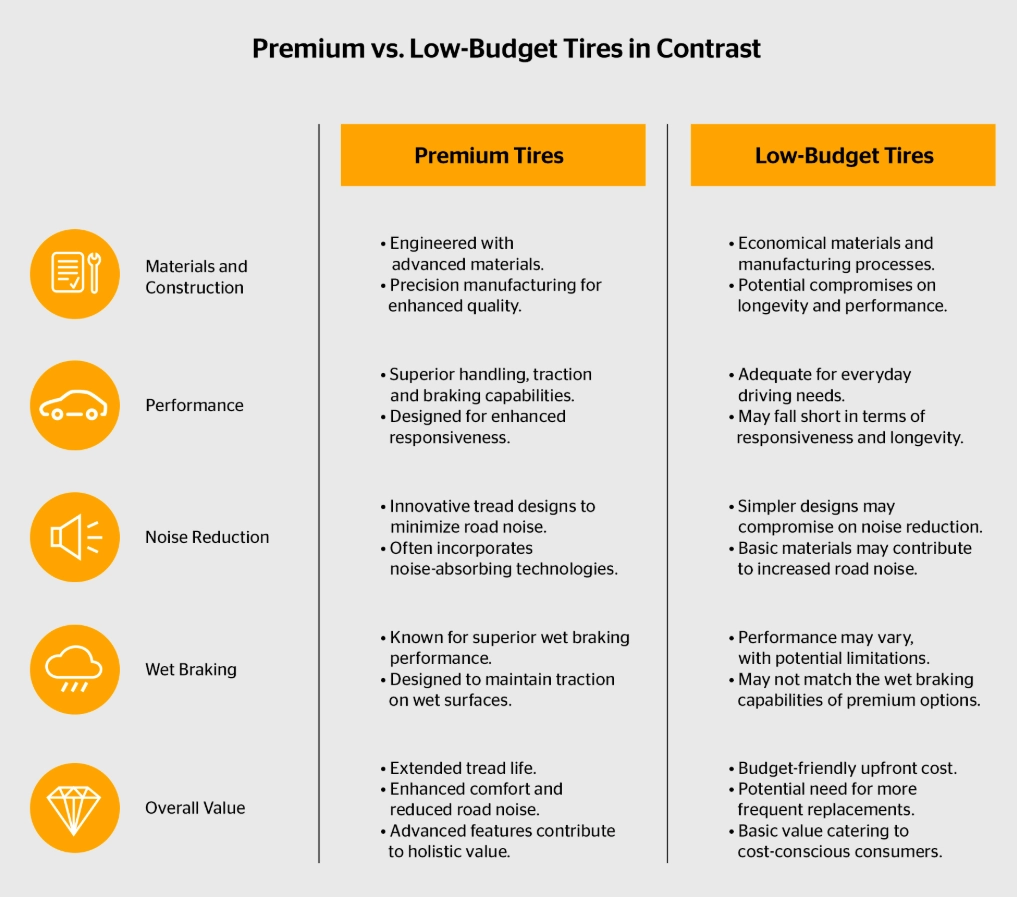
Real operations highlight stark contrasts between premium and economy choices.
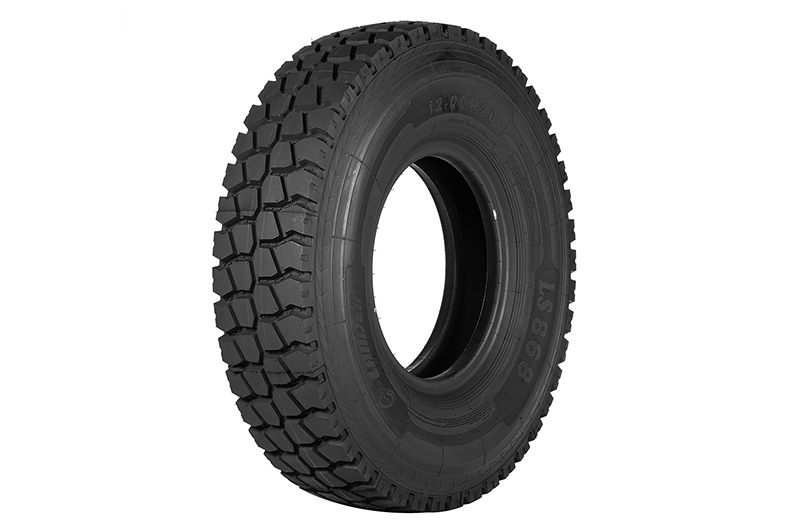
A mid-sized trucking company tracked two similar routes. One group ran premium TBR tyres, the other economy alternatives. Premium sets carried higher initial prices but achieved significantly more kilometers.
Fuel records showed lower consumption with premium options. Rolling resistance differences translated into measurable savings at the pump.
Downtime told another story. Economy tyres suffered more roadside issues, leading to longer off-road periods. Premium sets kept vehicles moving with fewer interruptions.
Over 18 months, premium tyres showed lower cost per kilometer despite higher purchase prices. The gap widened as retreading became viable for premium casings but not economy ones.
Similar patterns appear in mixed fleets. Operations mixing categories find premium investments returning value through extended service and reduced secondary expenses.
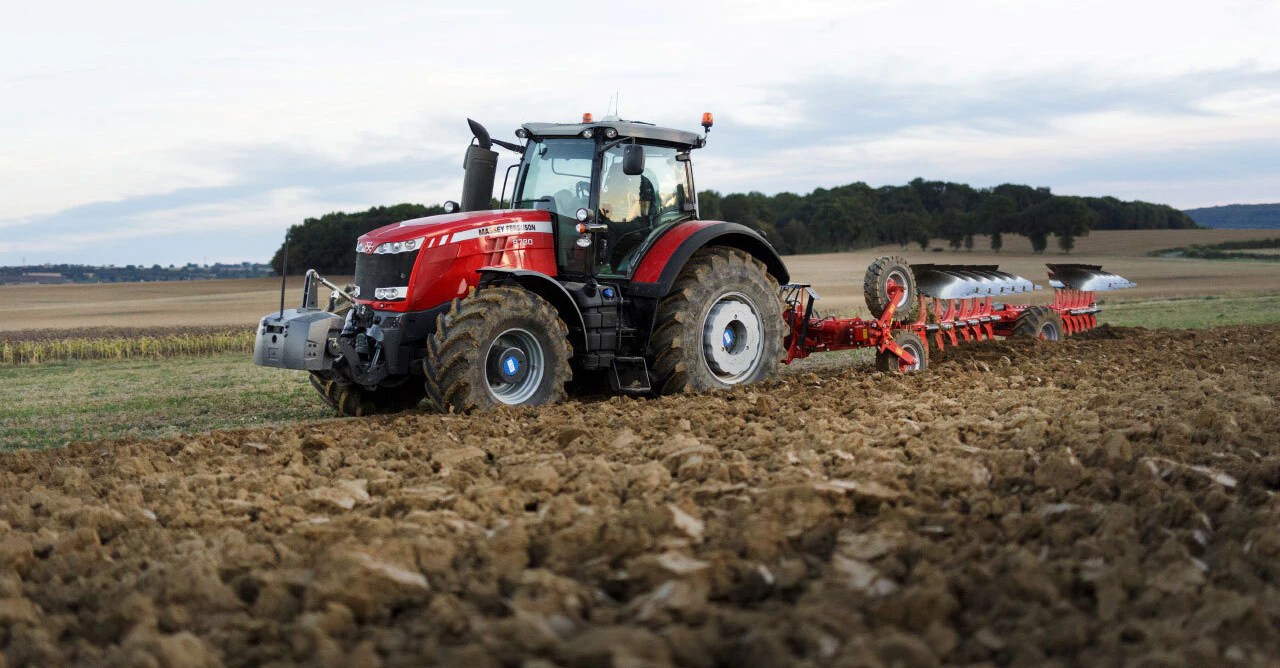
Construction equipment tells parallel tales. Premium options withstand site abuse longer, cutting replacement frequency. Initial savings from economy choices evaporate under heavy loads.
Impact of Fuel Efficiency and Rolling Resistance
Fuel represents a major variable cost for most fleets.
Rolling resistance determines how much energy tyres consume. Lower resistance means less drag against forward motion. Engines work less hard to maintain speed.
Data from highway operations indicates rolling resistance influencing fuel use substantially. Small reductions yield large savings across high-mileage routes.
Long-haul examples demonstrate this clearly. Fleets adopting low-resistance designs report consistent drops in consumption. Savings accumulate quickly with diesel prices.
Combined with longer wear, these efficiencies push total costs down. Initial investments recover through ongoing reductions.
Regional delivery routes show similar trends. Shorter trips still benefit from reduced pump stops and lower overall burn.
Hidden Costs of Downtime
Unplanned stops carry expenses beyond repair bills.
Driver wages continue during waits. Vehicles sit idle instead of generating revenue. Schedules slip, affecting customer commitments.
One breakdown can cascade. Delayed loads trigger penalties or lost contracts. Replacement scheduling adds administrative burden.
Reliable tyres minimize these risks. Stronger constructions resist damage that causes sudden failures. Consistent performance keeps operations flowing.
Fleets tracking downtime find tyre-related issues ranking high among causes. Addressing root problems through better selection cuts these indirect costs noticeably.
Off-road settings magnify effects. Remote sites extend repair times. Towing and parts delivery compound delays.
Selection and Optimization Guidelines
Smart choices start with matching needs to capabilities.
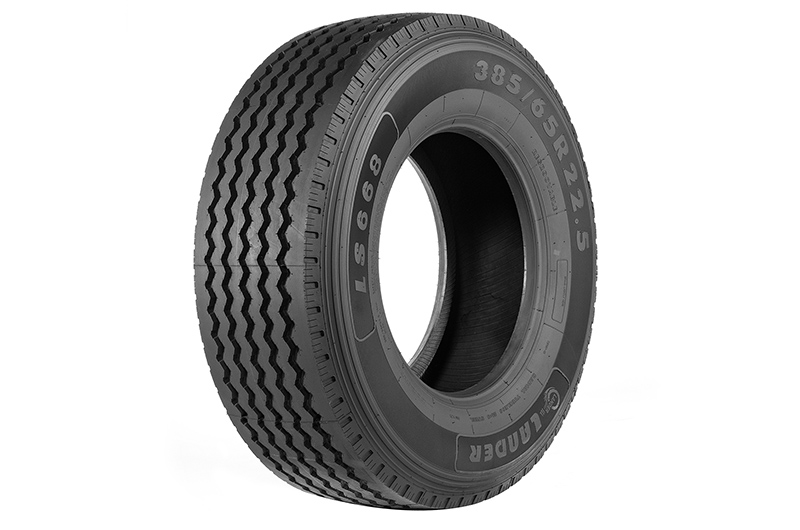
Assess duty cycles first. Highway routes favor low rolling resistance and long wear. Mixed or severe conditions demand durability trade-offs.
Certification provides benchmarks. Established standards validate performance claims under controlled testing.
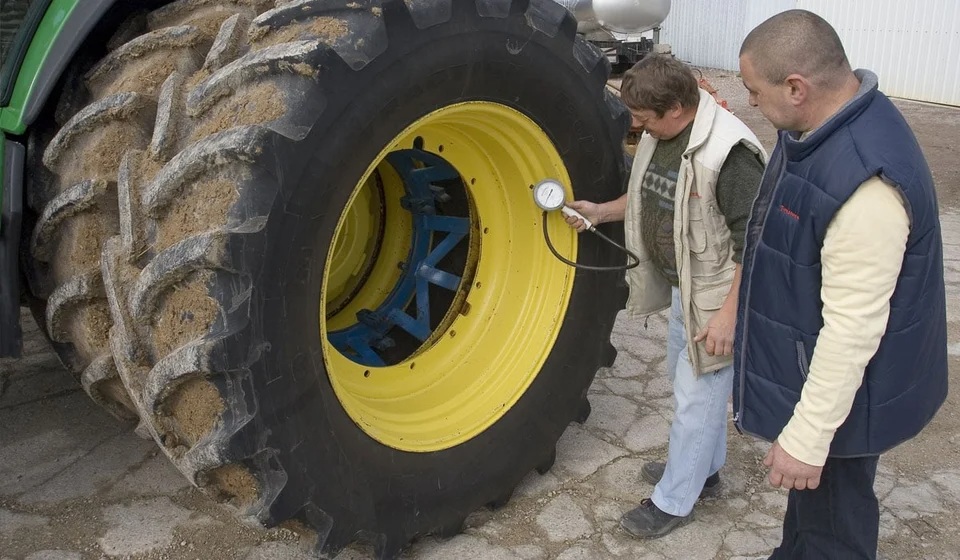
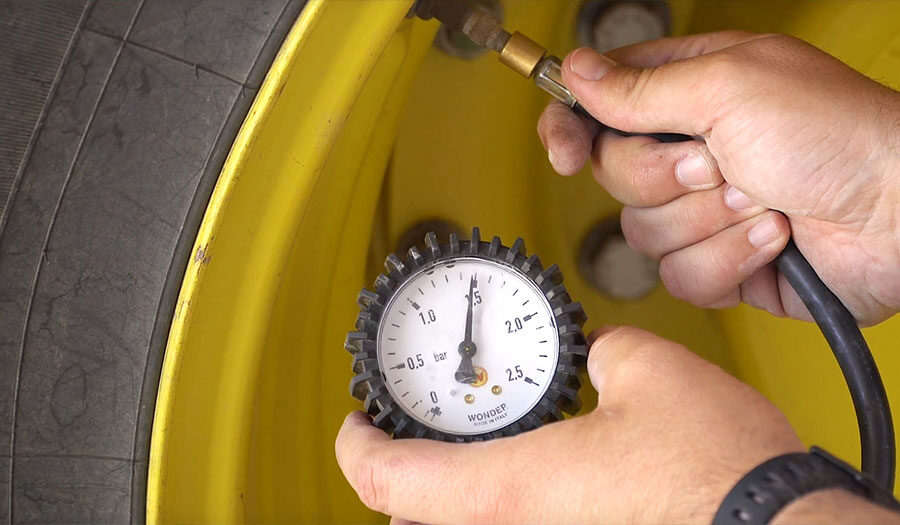
Maintenance practices extend value. Regular pressure checks preserve fuel efficiency and wear patterns. Alignment corrections prevent uneven loss.
Retreading viability matters for total economics. Strong casings support multiple lives, spreading costs further.
Tracking actual results closes the loop. Record mileage, fuel use, and incidents per set. Compare against projections to refine future decisions.
Supplier partnerships aid accuracy. Detailed performance data and warranty support inform models.
Introducing Qingdao Lander Sky Tyre
As an example of how manufacturers support lifecycle cost optimization, Qingdao Lander Sky Tyre provides solutions across multiple applications.
Qingdao Lander Sky Tyre produces TBR, OTR, agricultural, industrial, and forklift tyres since 2013. Facilities cover more than 3000 square meters across five workshops, handling full production from refining to final X-ray inspection.
Exports reach over 50 countries, supported by DOT, ECE, GCC, and CCC certifications. A three-year warranty covers all categories, reflecting confidence in design and manufacturing consistency.
Complete category coverage supports diverse fleet requirements with consistent standards.
Conclusion
Fleet tyre cost modeling through cost per kilometer or hour shifts focus from initial price to total ownership expense. Factoring lifespan, fuel efficiency, and downtime reveals true economics.
Operations applying lifecycle views position themselves for lower overall spending and more reliable performance across varied applications.
FAQs
How does fleet tyre cost modeling account for fuel differences?
It includes rolling resistance impact on consumption, showing how lower-resistance options reduce expenses over distance.
What makes premium tyres show lower cost per kilometer?
Longer lifespan and better fuel efficiency offset higher initial prices in calculations.
Why include downtime in tyre lifecycle cost estimates?
Unexpected stops add driver idle time and lost revenue that reliable tyres help avoid.
How can fleets calculate cost per hour for mixed operations?
Divide total expenses by operating hours, capturing slow-speed impacts common in off-road work.
Which factors most influence tyre cost per kilometer results?
Lifespan, rolling resistance, and downtime frequency drive the largest variations between options.


Leave a comments